
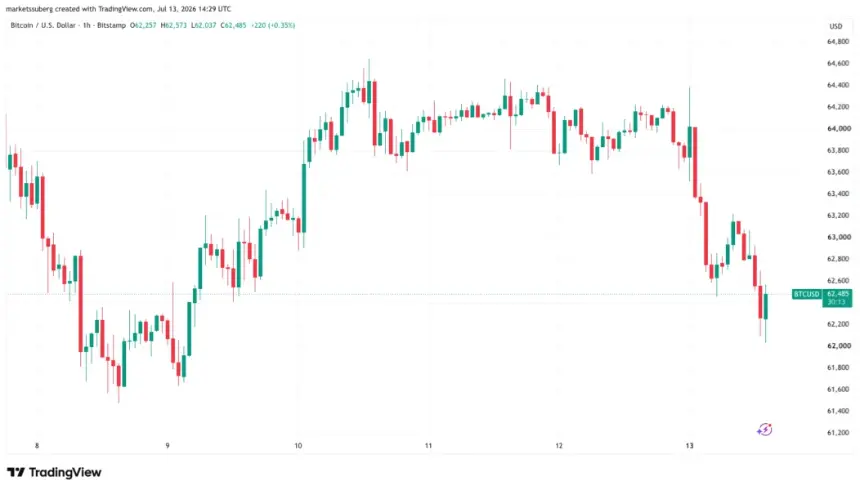
Bitcoin (BTC) extended its losses into Monday’s Wall Street open as global markets reacted to escalating tensions between the United States and Iran. The cryptocurrency edged closer to the $62,000 mark amid what traders described as “massive” short selling pressure.
BTC one-hour chart. Source: Cointelegraph/TradingView
U.S. stocks opened broadly lower, with the Nasdaq Composite Index down 1% at the time of writing. The sell-off followed remarks by former President Donald Trump, who stated on Fox News that the U.S. should “run” the Strait of Hormuz—a critical oil shipping lane recently closed by Iran.
“We’re going to keep the strait, and we’ll probably run it. We’ll become the guardian of the strait. Maybe we’ll call it the ‘guardian angel’ of the strait. And we should be reimbursed for that,” Trump said.

Oil prices rose in response, with WTI crude hovering around $75 per barrel.
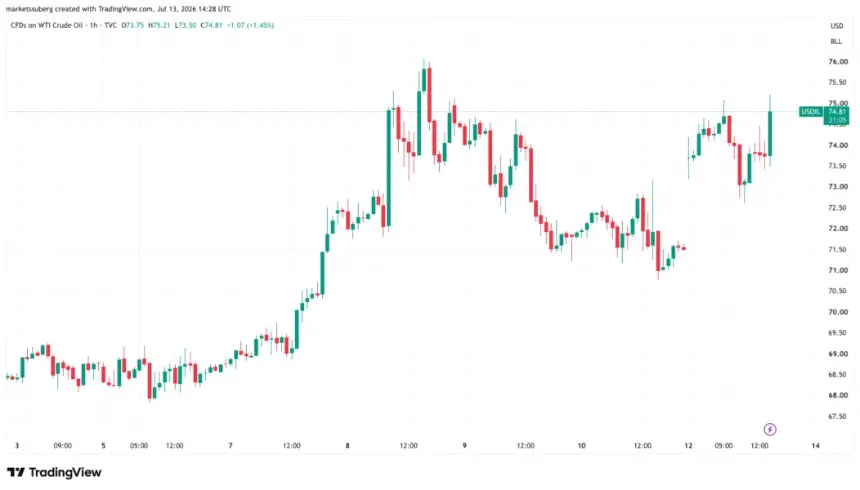
CFDs on US WTI crude oil one-hour chart. Source: Cointelegraph/TradingView
Bitcoin faced intense downward pressure after an initial drop following the weekly close. Analytics account JDK Analysis noted on X (formerly Twitter): “Massive shorting into this pre NY-open drop. Price is now sitting directly at mVWAP, a key level bulls need to defend!” The post warned that a break below this volume-weighted average price could retest the $60,000 support level.
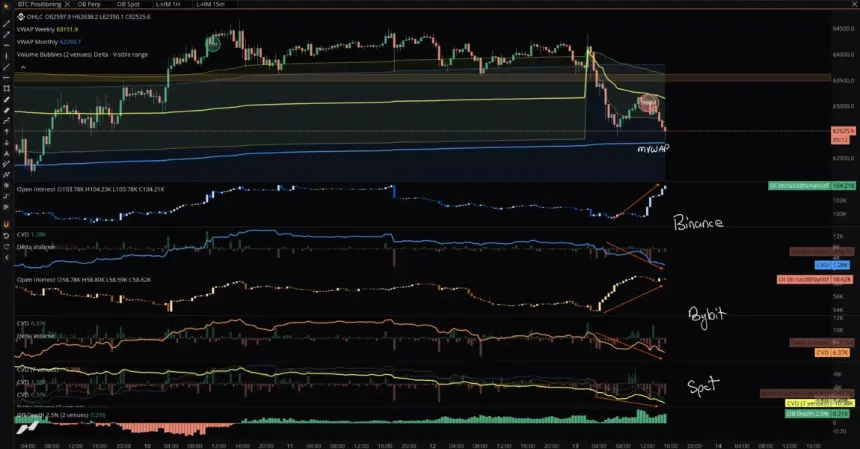
BTC chart with order-book data. Source: JDK Analysis/X
Commentator Exitpump also observed a “crazy amount of aggressive shorting,” even as open interest continued to climb—indicating sustained bearish sentiment.
Despite the weakness, some analysts remain optimistic about a near-term rebound. Trader Roman maintained a bullish outlook on X, citing technical indicators such as the Relative Strength Index (RSI) and on-chain exchange data showing more spot buying than selling.
“I believe a move higher is coming—it all just comes down to formation and how we get there,” Roman wrote. “Lots of HTF & LTF indications for 70–75k area + exchange data is showing that more spot is being bought than sold. It’s a matter of when, not if.”
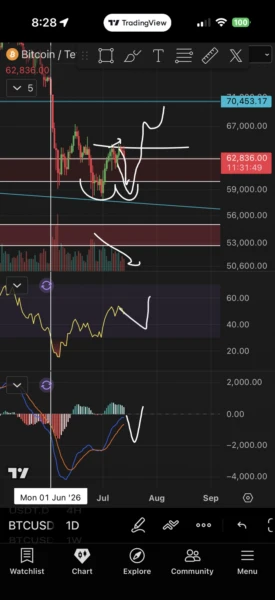
BTC one-day chart. Source: Roman/X
Earlier reports from Cointelegraph suggested expectations of continued upside toward $70,000 before a potential bearish phase later in the quarter, possibly culminating in a macro bottom in Q3.
免责声明:以上内容(如有图片或视频亦包括在内)均为平台用户上传并发布,本平台仅提供信息存储服务,对本页面内容所引致的错误、不确或遗漏,概不负任何法律责任,相关信息仅供参考。
本站尊重他人的知识产权、名誉权等法律法规所规定的合法权益!如网页中刊载的文章或图片涉及侵权,请提供相关的权利证明和身份证明发送邮件到qklwk88@163.com,本站相关工作人员将会进行核查处理回复
